Chart.js
Overview
On this page, you'll learn:
- What is Chart.js
- How to use Chart.js configuration object as input for Image-Charts
- How to customize your Chart.js image chart
Chart.js is most popular open-source charting library. Image Charts supports Chart.js configuration object as input in the URL.
A Chart.js definition like the one below is represented in JavaScript Object Notation (JSON). Take a look at Chart.js documentation to discover all the available parameters.
{
  "type": "line",
  "data": {
    "labels": ["Jan", "Feb", "Mar", "Apr", "May", "Jun", "Jul", "Aug"],
    "datasets": [
      {
        "backgroundColor": "rgba(255,150,150,0.5)",
        "borderColor": "rgb(255,150,150)",
        "data": [-23, 64, 21, 53, -39, -30, 28, -10],
        "label": "Dataset",
        "fill": "origin"
      }
    ]
  }
}
Chart definition
To generate chart image using chart.js object format, put the Chart.js definition object in the URL using the chart (or c) query parameter, like this:
https://image-charts.com/chart.js/2.8.0?bkg=white&c={type:'line',data:{labels:['Jan','Feb','Mar','Apr','May','Jun','Jul','Aug'],datasets:[{backgroundColor:'rgba(255,150,150,0.5)',borderColor:'rgb(255,150,150)',data:[-23,64,21,53,-39,-30,28,-10],label:'Dataset',fill:'origin'}]}}
Image-Charts will take Chart.js configuration as input and render it on its world-wide distributed backends as an image.
%27%2CborderColor%3A%27rgb(255%2C150%2C150)%27%2Cdata%3A%5B-23%2C64%2C21%2C53%2C-39%2C-30%2C28%2C-10%5D%2Clabel%3A%27Dataset%27%2Cfill%3A%27origin%27%7D%5D%7D%7D)
Let's take another example, a pie chart with Chart.js will be something like:
{
  "type": "pie",
  "data": {
    "datasets": [
      {
        "data": [84, 28, 57, 19, 97],
        "backgroundColor": [
          "rgba(255,99,132,0.5)",
          "rgba(255,159,64,0.5)",
          "rgba(255,205,86,0.5)",
          "rgba(75,192,192,0.5)",
          "rgba(54,162,235,0.5)"
        ],
        "label": "Dataset 1"
      }
    ],
    "labels": ["Red", "Orange", "Yellow", "Green", "Blue"]
  }
}
In order to render it as an image, we will use Image-Charts API:
https://image-charts.com/chart.js/2.8.0?bkg=white&c={%20%22type%22:%20%22pie%22,%20%22data%22:%20{%20%22datasets%22:%20[%20{%20%22data%22:%20[84,%2028,%2057,%2019,%2097],%20%22backgroundColor%22:%20[%20%22rgba(255,99,132,0.5)%22,%20%22rgba(255,159,64,0.5)%22,%20%22rgba(255,205,86,0.5)%22,%20%22rgba(75,192,192,0.5)%22,%20%22rgba(54,162,235,0.5)%22%20],%20%22label%22:%20%22Dataset%201%22%20}%20],%20%22labels%22:%20[%22Red%22,%20%22Orange%22,%20%22Yellow%22,%20%22Green%22,%20%22Blue%22]%20}%20}
%22,%20%22rgba(255,159,64,0.5)%22,%20%22rgba(255,205,86,0.5)%22,%20%22rgba(75,192,192,0.5)%22,%20%22rgba(54,162,235,0.5)%22%20%5D,%20%22label%22:%20%22Dataset%201%22%20%7D%20%5D,%20%22labels%22:%20%5B%22Red%22,%20%22Orange%22,%20%22Yellow%22,%20%22Green%22,%20%22Blue%22%5D%20%7D%20%7D)
Some JSON character (like #) do not work well inside URLs. It's recommended to always URL-encode the chart definition.
Chart.js version
Depending on your project requirements and usage, Image-Charts API can handles multiple version of chart.js definition object. Chart.js version is defined as follow:
https://image-charts/chart.js/{version}
With version being one of:
2.8.0(documentation- Need another version for your project? Contact us
Chart size
Both the width and height of the chart output image can be specified in pixel using width and height query parameters. Default values are width=400 and height=300.
Here is a 300x200 chart:
https://image-charts.com/chart.js/2.8.0
?width=300
&height=200
&bkg=white
&c={"type":"bar","data":{"labels":["January","February","March","April","May","June","July"],"datasets":[{"backgroundColor":"rgba(54,162,235,0.5)","borderColor":"rgb(54,162,235)","borderWidth":1,"data":[73,41,29,61,-65,59,38]}]},"options":{"legend":{"display":false}}}
%22%2C%22borderColor%22%3A%22rgb(54%2C162%2C235)%22%2C%22borderWidth%22%3A1%2C%22data%22%3A%5B73%2C41%2C29%2C61%2C-65%2C59%2C38%5D%7D%5D%7D%2C%22options%22%3A%7B%22legend%22%3A%7B%22display%22%3Afalse%7D%7D%7D)
Background color
Chart background color can be defined with the backgroundColor (or bkg) query parameter. Image charts accepts multiple color format:
- rgb:
bkg=rgb(255,255,120),backgroundColor=rgb(0,0,0) - named colors (default value is
black):backgroundColor=red,bkg=white - url-encoded hex values:
bkg=%23ff00ff,backgroundColor=%23ffff00
Here is a bubble chart with a near white background (bkg=%23FCFCFC):
%22%2CborderColor%3A%22rgb(255%2C99%2C132)%22%2CborderWidth%3A1%2Cdata%3A%5B%7Bx%3A62%2Cy%3A94%2Cr%3A9.8%2C%7D%2C%7Bx%3A-62%2Cy%3A-34%2Cr%3A7.4%2C%7D%2C%7Bx%3A8%2Cy%3A60%2Cr%3A1.8%2C%7D%2C%7Bx%3A-44%2Cy%3A59%2Cr%3A9.4%2C%7D%2C%7Bx%3A64%2Cy%3A46%2Cr%3A6.8%2C%7D%2C%7Bx%3A16%2Cy%3A-95%2Cr%3A10.8%2C%7D%2C%7Bx%3A95%2Cy%3A-80%2Cr%3A1.8%2C%7D%2C%5D%2C%7D%2C%7B%22backgroundColor%22%3A%22rgba(54%2C162%2C235%2C0.5)%22%2C%22borderColor%22%3A%22rgb(54%2C162%2C235)%22%2CborderWidth%3A1%2Cdata%3A%5B%7Bx%3A-15%2Cy%3A-28%2Cr%3A14.8%2C%7D%2C%7Bx%3A-31%2Cy%3A-53%2Cr%3A11%2C%7D%2C%7Bx%3A-70%2Cy%3A-74%2Cr%3A14%2C%7D%2C%7Bx%3A-48%2Cy%3A-6%2Cr%3A7%2C%7D%2C%7Bx%3A-82%2Cy%3A34%2Cr%3A13.6%2C%7D%2C%7Bx%3A-89%2Cy%3A-71%2Cr%3A16.8%2C%7D%2C%7Bx%3A15%2Cy%3A-38%2Cr%3A0.2%2C%7D%2C%5D%7D%5D%7D%2C%22options%22%3A%7B%22legend%22%3A%7B%22display%22%3Afalse%7D%7D%7D)
bkg=%23FCFCFC
c={type:'bubble',data:{datasets:[{backgroundColor:'rgba(255,99,132,0.5)',borderColor:'rgb(255,99,132)',borderWidth:1,data:[{x:62,y:94,r:9.8,},{x:-62,y:-34,r:7.4,},{x:8,y:60,r:1.8,},{x:-44,y:59,r:9.4,},{x:64,y:46,r:6.8,},{x:16,y:-95,r:10.8,},{x:95,y:-80,r:1.8,},],},{"backgroundColor":"rgba(54,162,235,0.5)","borderColor":"rgb(54,162,235)",borderWidth:1,data:[{x:-15,y:-28,r:14.8,},{x:-31,y:-53,r:11,},{x:-70,y:-74,r:14,},{x:-48,y:-6,r:7,},{x:-82,y:34,r:13.6,},{x:-89,y:-71,r:16.8,},{x:15,y:-38,r:0.2,},]}]},"options":{"legend":{"display":false}}}
The same bubble chart with a black background expressed in rgb format (bkg=rgb(0,0,0)):
&c=%7Btype%3A%22bubble%22%2Cdata%3A%7Bdatasets%3A%5B%7BbackgroundColor%3A%22rgba(255%2C99%2C132%2C0.5)%22%2CborderColor%3A%22rgb(255%2C99%2C132)%22%2CborderWidth%3A1%2Cdata%3A%5B%7Bx%3A62%2Cy%3A94%2Cr%3A9.8%2C%7D%2C%7Bx%3A-62%2Cy%3A-34%2Cr%3A7.4%2C%7D%2C%7Bx%3A8%2Cy%3A60%2Cr%3A1.8%2C%7D%2C%7Bx%3A-44%2Cy%3A59%2Cr%3A9.4%2C%7D%2C%7Bx%3A64%2Cy%3A46%2Cr%3A6.8%2C%7D%2C%7Bx%3A16%2Cy%3A-95%2Cr%3A10.8%2C%7D%2C%7Bx%3A95%2Cy%3A-80%2Cr%3A1.8%2C%7D%2C%5D%2C%7D%2C%7B%22backgroundColor%22%3A%22rgba(54%2C162%2C235%2C0.5)%22%2C%22borderColor%22%3A%22rgb(54%2C162%2C235)%22%2CborderWidth%3A1%2Cdata%3A%5B%7Bx%3A-15%2Cy%3A-28%2Cr%3A14.8%2C%7D%2C%7Bx%3A-31%2Cy%3A-53%2Cr%3A11%2C%7D%2C%7Bx%3A-70%2Cy%3A-74%2Cr%3A14%2C%7D%2C%7Bx%3A-48%2Cy%3A-6%2Cr%3A7%2C%7D%2C%7Bx%3A-82%2Cy%3A34%2Cr%3A13.6%2C%7D%2C%7Bx%3A-89%2Cy%3A-71%2Cr%3A16.8%2C%7D%2C%7Bx%3A15%2Cy%3A-38%2Cr%3A0.2%2C%7D%2C%5D%7D%5D%7D%2C%22options%22%3A%7B%22legend%22%3A%7B%22display%22%3Afalse%7D%7D%7D)
bkg=rgb(0,0,0)
chart={type:'bubble',data:{datasets:[{backgroundColor:'rgba(255,99,132,0.5)',borderColor:'rgb(255,99,132)',borderWidth:1,data:[{x:62,y:94,r:9.8,},{x:-62,y:-34,r:7.4,},{x:8,y:60,r:1.8,},{x:-44,y:59,r:9.4,},{x:64,y:46,r:6.8,},{x:16,y:-95,r:10.8,},{x:95,y:-80,r:1.8,},],},{"backgroundColor":"rgba(54,162,235,0.5)","borderColor":"rgb(54,162,235)",borderWidth:1,data:[{x:-15,y:-28,r:14.8,},{x:-31,y:-53,r:11,},{x:-70,y:-74,r:14,},{x:-48,y:-6,r:7,},{x:-82,y:34,r:13.6,},{x:-89,y:-71,r:16.8,},{x:15,y:-38,r:0.2,},]}]},"options":{"legend":{"display":false}}}
Encoding
To reduce the whole URL size and don't run into issues, chart definition can be encoded with encoding query parameter.
Accepted values are encoding=url and encoding=base64. Default values is encoding=url.
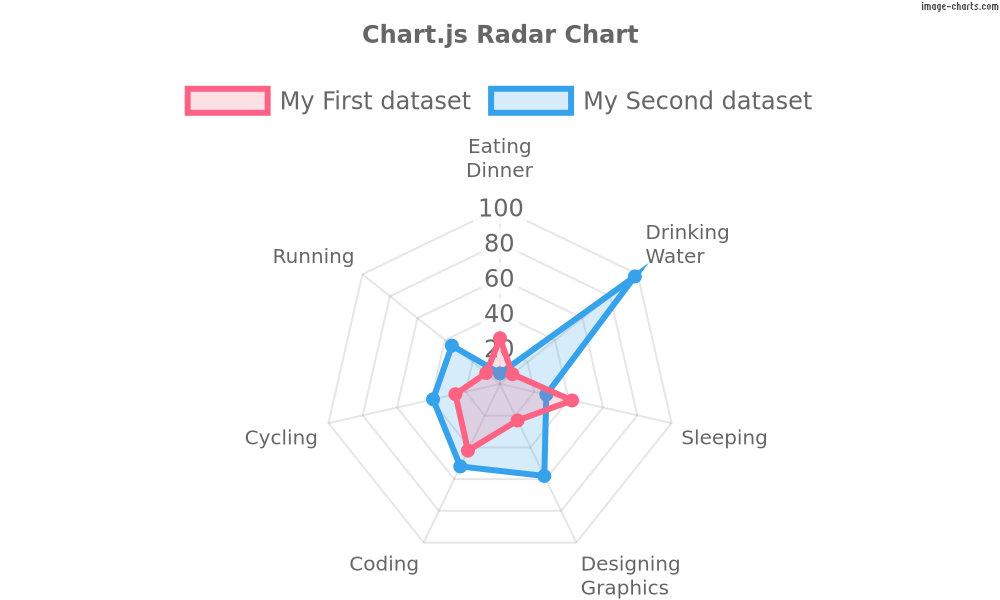
Encoding the URL in base64 (encoding=base64):
https://image-charts.com/chart.js/2.8.0
?encoding=base64
&bkg=white
&c=ewogIHR5cGU6ICdyYWRhcicsCiAgZGF0YTogewogICAgbGFiZWxzOiBbCiAgICAgIFsnRWF0aW5nJywgJ0Rpbm5lciddLAogICAgICBbJ0RyaW5raW5nJywgJ1dhdGVyJ10sCiAgICAgICdTbGVlcGluZycsCiAgICAgIFsnRGVzaWduaW5nJywgJ0dyYXBoaWNzJ10sCiAgICAgICdDb2RpbmcnLAogICAgICAnQ3ljbGluZycsCiAgICAgICdSdW5uaW5nJywKICAgIF0sCiAgICBkYXRhc2V0czogWwogICAgICB7CiAgICAgICAgbGFiZWw6ICdNeSBGaXJzdCBkYXRhc2V0JywKICAgICAgICBiYWNrZ3JvdW5kQ29sb3I6ICdyZ2JhKDI1NSwgOTksIDEzMiwgMC4yKScsCiAgICAgICAgYm9yZGVyQ29sb3I6ICdyZ2IoMjU1LCA5OSwgMTMyKScsCiAgICAgICAgcG9pbnRCYWNrZ3JvdW5kQ29sb3I6ICdyZ2IoMjU1LCA5OSwgMTMyKScsCiAgICAgICAgZGF0YTogWzI2LCA5LCA0MiwgMjMsIDQyLCAyNiwgMTBdLAogICAgICB9LAogICAgICB7CiAgICAgICAgbGFiZWw6ICdNeSBTZWNvbmQgZGF0YXNldCcsCiAgICAgICAgYmFja2dyb3VuZENvbG9yOiAncmdiYSg1NCwgMTYyLCAyMzUsIDAuMiknLAogICAgICAgIGJvcmRlckNvbG9yOiAncmdiKDU0LCAxNjIsIDIzNSknLAogICAgICAgIHBvaW50QmFja2dyb3VuZENvbG9yOiAncmdiKDU0LCAxNjIsIDIzNSknLAogICAgICAgIGRhdGE6IFs2LCA5OCwgMjcsIDU4LCA1MiwgMzksIDM1XSwKICAgICAgfSwKICAgIF0sCiAgfSwKICBvcHRpb25zOiB7CiAgICB0aXRsZTogewogICAgICBkaXNwbGF5OiB0cnVlLAogICAgICB0ZXh0OiAnQ2hhcnQuanMgUmFkYXIgQ2hhcnQnLAogICAgfSwKICB9LAp9Cg==
Basic URL encoding (encoding=url):
%27%2C%27rgba(255%2C159%2C64%2C0.5)%27%2C%27rgba(255%2C205%2C86%2C0.5)%27%2C%27rgba(75%2C192%2C192%2C0.5)%27%2C%27rgba(54%2C162%2C235%2C0.5)%27%2C%5D%7D%5D%7D%2Coptions%3A%7Btitle%3A%7Bdisplay%3Atrue%2Ctext%3A%27Chart.jsPolarAreaChart%27%2C%7D%7D%7D&encoding=url)
bkg=white
c={type:'polarArea',data:{datasets:[{data:[3,56,61,78,83],backgroundColor:['rgba(255,99,132,0.5)','rgba(255,159,64,0.5)','rgba(255,205,86,0.5)','rgba(75,192,192,0.5)','rgba(54,162,235,0.5)',]}]},options:{title:{display:true,text:'Chart.jsPolarAreaChart',}}}
encoding=url
Datalabels
Display labels on data for any type of charts
{
  type: "bar",
  data: {
    labels: ["January", "February", "March", "April", "May", "June", "July"],
    datasets: [
      {
        label: "Dataset 1",
        data: [-31, -70, -30, -33, -9, 14, -41]
      },
      {
        label: "Dataset 2",
        data: [73, 41, 29, 61, -65, 59, 38],
        datalabels: {
          labels: null,
          font: {
            size: "50"
          }
        }
      }
    ]
  },
  options: {
    datalabels: [["one"], ["two"], ["three"], ["four"], ["five"]],
    responsive: true,
    legend: {
      position: "top"
    }
  }
}

{
  type: "radar",
  data: {
    labels: ["January", "February", "March", "April", "May", "June", "July"],
    datasets: [
      {
        label: "Dataset 1",
        data: [-31, -70, -30, -33, -9, 14, -41]
      },
      {
        label: "Dataset 2",
        data: [73, 41, 29, 61, -65, 59, 38],
        datalabels: {
          labels: null,
          font: {
            size: "50"
          }
        }
      }
    ]
  },
  options: {
    datalabels: [["one"], ["two"], ["three"], ["four"], ["five"]],
    responsive: true,
    legend: {
      position: "top"
    }
  }
}

Remove the watermark
You will receive an account_id and a secret_key upon signup. To authenticate your requests and thus remove the watermark, the whole query string must be signed with the ichm= query parameter. To learn more about how to sign Image-Charts API requests, check out Enterprise documentation section.
icac=account_id
ichm=generated_hash
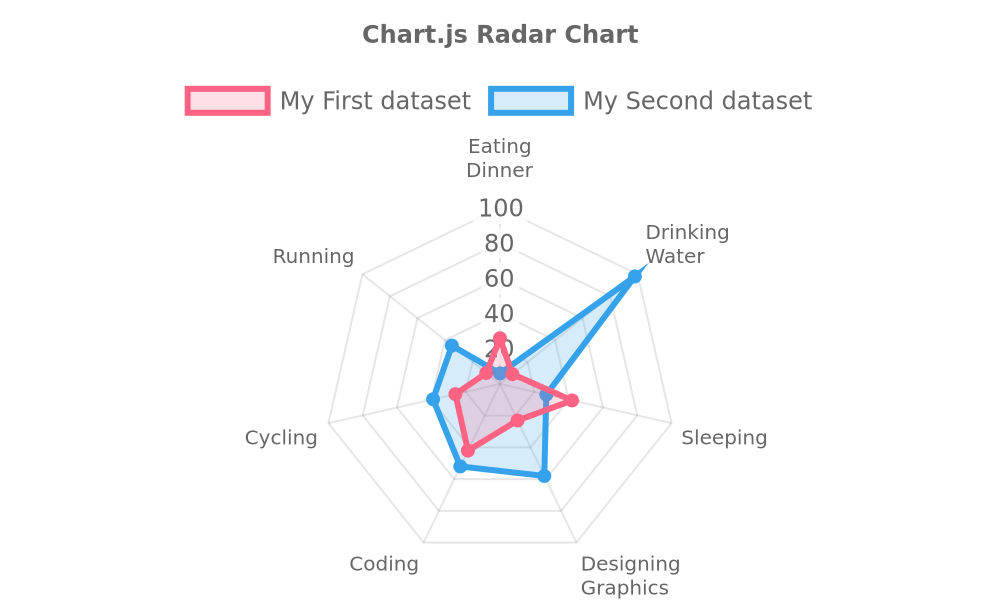
Here is an example of a signed chart URL thus without a watermark. Observe the icacand ichm query parameter:
https://image-charts.com/chart.js/2.8.0
?bkg=white
&icac=documentation
&c=ewogIHR5cGU6ICdyYWRhcicsCiAgZGF0YTogewogICAgbGFiZWxzOiBbCiAgICAgIFsnRWF0aW5nJywgJ0Rpbm5lciddLAogICAgICBbJ0RyaW5raW5nJywgJ1dhdGVyJ10sCiAgICAgICdTbGVlcGluZycsCiAgICAgIFsnRGVzaWduaW5nJywgJ0dyYXBoaWNzJ10sCiAgICAgICdDb2RpbmcnLAogICAgICAnQ3ljbGluZycsCiAgICAgICdSdW5uaW5nJywKICAgIF0sCiAgICBkYXRhc2V0czogWwogICAgICB7CiAgICAgICAgbGFiZWw6ICdNeSBGaXJzdCBkYXRhc2V0JywKICAgICAgICBiYWNrZ3JvdW5kQ29sb3I6ICdyZ2JhKDI1NSwgOTksIDEzMiwgMC4yKScsCiAgICAgICAgYm9yZGVyQ29sb3I6ICdyZ2IoMjU1LCA5OSwgMTMyKScsCiAgICAgICAgcG9pbnRCYWNrZ3JvdW5kQ29sb3I6ICdyZ2IoMjU1LCA5OSwgMTMyKScsCiAgICAgICAgZGF0YTogWzI2LCA5LCA0MiwgMjMsIDQyLCAyNiwgMTBdLAogICAgICB9LAogICAgICB7CiAgICAgICAgbGFiZWw6ICdNeSBTZWNvbmQgZGF0YXNldCcsCiAgICAgICAgYmFja2dyb3VuZENvbG9yOiAncmdiYSg1NCwgMTYyLCAyMzUsIDAuMiknLAogICAgICAgIGJvcmRlckNvbG9yOiAncmdiKDU0LCAxNjIsIDIzNSknLAogICAgICAgIHBvaW50QmFja2dyb3VuZENvbG9yOiAncmdiKDU0LCAxNjIsIDIzNSknLAogICAgICAgIGRhdGE6IFs2LCA5OCwgMjcsIDU4LCA1MiwgMzksIDM1XSwKICAgICAgfSwKICAgIF0sCiAgfSwKICBvcHRpb25zOiB7CiAgICB0aXRsZTogewogICAgICBkaXNwbGF5OiB0cnVlLAogICAgICB0ZXh0OiAnQ2hhcnQuanMgUmFkYXIgQ2hhcnQnLAogICAgfSwKICB9LAp9Cg==
&encoding=base64
&ichm=c31c38d85cee460cb144828909d1deb2082ddb7b42e7d6713df93e9ad4507c65
JavaScript function (callbacks)
Image-Charts does not support Chart.js JavaScript function as value feature for reliability reasons.
Extensions
Image-Charts comes bundled with production battle-tested extensions.
Rounded bar charts
Examples
Bar chart below has 3 datasets and each bar has 10px rounded corners:
{
  "type": "bar",
  ...
  "options": {
    ...
    "rectangleRadius": 10,
  }
}

Background image
Background image are only available with Enterprise and Enterprise+ subscriptions
Syntax
Defining a background image for a chart in Chart.js is done through a backgroundImage plugin that requires an url attribute. The image will take up all the available space.
{
 "options":{
    "plugins":{
        "backgroundImage":{
            "url":"https://i.imgur.com/hCyint9.jpg"
        }
    }
 }
}
Examples
The example below displays a bar charts with two series and a full size background image.
{
  type: 'bar',

  ...

  options: {
    ...

    plugins: {
      backgroundImage: {
        url: 'https://i.imgur.com/bQcg21b.jpg'
      }
    }
  }
}
